London and climate change
Sunday, 29 March 2009
Chronic Arsenic Poisoning:BANGLADESH

Arsenic poisoning has emerged as a fresh blow to Bangladesh, a country of 130 million population, known as a land of frequent natural calamities. Recent surveys showed that about 80 million people of the country are living under the risk of Arsenic poisoning as the groundwater of a vast region contaminated with Arsenic the Arsenic pollution is not only causing serious health hazard to the people, but also affecting the environment and creating social problems.
Arsenic poisoning was first detected in Bangladesh in 1993 by the Department of Public Health Engineering (DPHE). But the fact remained behind the screen till 1996. According to the latest surveys conducted at both Government levels, at least 53 out of the total 64 districts of Bangladesh are affected with Arsenic pollution
Friday, 27 March 2009
Thirst refusal | Environment | The Guardian

The destruction of nearly 182,000 hectares (450,000 acres) and the displacement of a million people by the worst Californian fire-storms in decades are focusing attention on what may, over the next 50 years, become the most pressing environmental issue in the US - the south-western states are drying up.

Diary: Colorado River drought

The south-western US is suffering its eighth consecutive year of drought. There are concerns that the Colorado River, which has sustained life in the area for thousands of years, can no longer meet the needs of the tens of millions of people living in major cities such as Las Vegas and Los Angeles.

The BBC's Matthew Price is travelling along the river to investigate the scale of the problem and is sending a series of diary items from there.
BBC NEWS | World | Africa | Ethiopia dam: Background

The Gibe III dam is under construction on the Omo River, approximately 300km southwest of Addis Ababa. It is the third in a series of cascading hydroelectric projects in the region.The first, the Gilgel Gibe dam (also called Gibe I), was completed north of the Gibe III dam site in 2004. The Gibe II project is a power plant associated with the Gibe I dam that is still under construction. The new Gibe III dam is expected to produce 6500 GWh of energy a year, and surplus energy is expected to create 300 million euros (£282m; $407m) in revenue, according to the Ethiopian Electric Power Corporation (EEPCo), the sole provider of power in Ethiopia. Ethiopia's neighbours, such as Djibouti, Yemen, Kenya, Uganda, Sudan and Egypt, would all be in a position to purchase the excess energy.
Acute Water Shortage May Cause Beijing Exodus

Chinese officials may be forced to resettle some of Beijing’s new arrivals over the next 5 to 10 years due to a population boom that accompanied both a rapid economic expansion and a decade-long stretch of yearly droughts. Probe International, an independent environmental advocacy group, advised Chinese officials that Beijing faces economic collapse as the capital begins to run out of water during that period.
The official Xinhua news agency reports that Beijing and the surrounding region have suffered drought every year since 1999. To deal with the changing climate, the country is building a multibillion-dollar scheme known as the North-South Water Diversion Project. Xinhua says that once completed, the project will divert one billion cubic yards of water to Beijing annually, mostly from the Yangtze River.
About 40 prcent of the water Beijing uses each year is normally extracted from the Miyun reservoir, an hour and half drive north of the capital. But the water stored behind its dam is now clearly depleated by a decade of drought.

Wednesday, 25 March 2009
Mexican Border

A recently constructed section of the controversial US-Mexico border fence expansion project crosses previously pristine desert sands at sunrise on March 14, 2009 between Yuma, Arizona and Calexico, California. The new barrier between the US and Mexico stands 15 feet tall and sits on top of the sand so it can lifted by a machine and repositioned whenever the migrating desert dunes begin to bury it. The almost seven miles of floating fence cost about $6 million per mile to build.

A Mexican soldier walks near a U.S.-Mexico border crossing in Ciudad Juarez, Mexico
Monday, 23 March 2009
Sunday, 22 March 2009

AQUASTAT - FAO's Information System on Water and Agriculture
The information system consists of:
Databases - The AQUASTAT main country database; Databases on African dams, on institutions, on river sediment yields, and on investment costs in irrigation
Countries and regions - Standardized text by country and by region on the state of water resources and agricultural water use
Climate information tool - A tool to provide climate estimates for the land surface of the globe
Water resources - Review of the statistics of renewable water resources by country
Agricultural water use - Review of agricultural water use by country
Global irrigation map - Global map of irrigated areas, which is a spatial dataset on areas equipped for irrigation
Maps and tables - A selection of downloadable maps and datasets on water and agriculture
AQUASTAT - FAO's Information System on Water and Agriculture
Circle of Blue | WaterNews

Circle of Blue is the international network of leading journalists, scientists and communications design experts that reports and presents the information necessary to respond to the global freshwater crisis. It is a nonprofit affiliate of the internationally recognized water, climate and policy think tank, the Pacific Institute.

Water themes and data — EEA
Clean fresh water is essential to life. Unfortunately, since the Industrial Revolution, most of Europe's rivers have been treated unwisely as a convenient way of transporting waste to the sea, affecting the biodiversity of thousands of kilometers of waterways, harming human health, and in the end polluting coastal and marine waters.
Thursday, 19 March 2009
DROUGHT
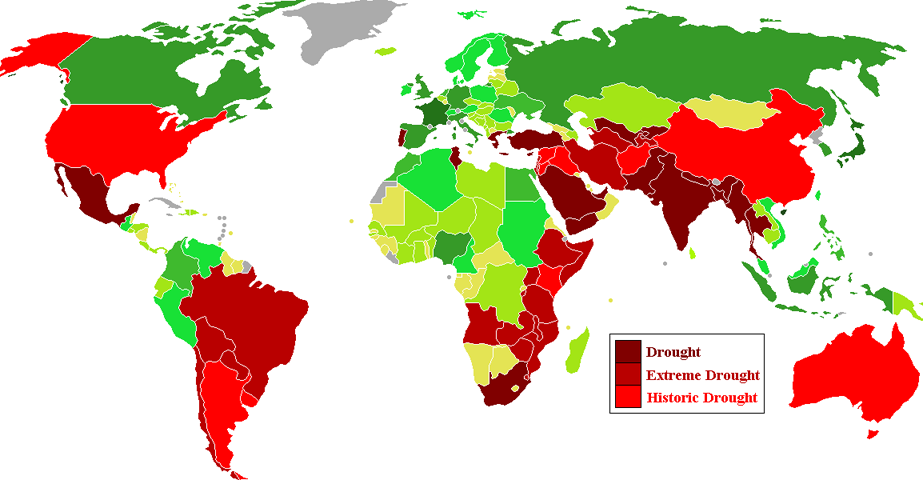
The countries that make up two thirds of the world’s agricultural output are experiencing drought conditions. Whether you watch a video of the drought in China, Australia, Africa, South America, or the US, the scene will be the same: misery, ruined crop, and dying cattle.
China
The drought in Northern China, the worst in 50 years, is worsening, and summer harvest is now threatened. The area of affected crops has expanded to 161 million mu (was 141 million last week), and 4.37 million people and 2.1 million livestock are facing drinking water shortage. The scarcity of rain in some parts of the north and central provinces is the worst in recorded history.
The drought which started in November threatens over half the wheat crop in eight provinces - Hebei, Shanxi, Anhui, Jiangsu, Henan, Shandong, Shaanxi and Gansu.
Henan China's largest crop producing province, Henan, has issued the highest-level drought warning. Henan has received an average rainfall of 10.5 millimeters since November 2008, almost 80 percent less than in the same period in the previous years. The Henan drought, which began in November, is the most severe since 1951.
Anhui Province issued a red drought alert, with more than 60 percent of the crops north of the Huaihe River plagued by a major drought.
Shanxi Province was put on orange drought alert on Jan. 21, with one million people and 160,000 heads of livestock are facing water shortage.
Jiangsu province has already lost over one fifth of the wheat crops affected by drought. Local agricultural departments are diverting water from nearby rivers in an emergency effort to save the rest.
Hebei Over 100 million cubic meters of water has been channeled in from outside the province to fight Hebei’s drought.
Shaanxi 1.34 million acres of crops across the bone-dry Shanxi province are affected by the worsening drought.
Since last November, Shandong province has experienced 73 percent less rain than the same period in previous years, with little rainfall forecast for the future.
Relief efforts are under way. The Chinese government has allocated 86.7 billion yuan (about $12.69 billion) to drought-hit areas. Authorities have also resorted to cloud-seeding, and some areas received a sprinkling of rain after clouds were hit with 2,392 rockets and 409 cannon shells loaded with chemicals. However, there is a limit to what can be done in the face of such widespread water shortage.
As I have previously written, China is facing hyperinflation, and this record drought will make things worse. China produces 18% of the world's grain each year.
Australia has been experiencing an unrelenting drought since 2004, and 41 percent of Australia's agriculture continues to suffer from the worst drought in 117 years of record-keeping. The drought has been so severe that rivers stopped flowing, lakes turned toxic, and farmers abandoned their land in frustration:
A) The Murray River stopped flowing at its terminal point, and its mouth has closed up.
B) Australia’s lower lakes are evaporating, and they are now a meter (3.2 feet) below sea level. If these lakes evaporate any further, the soil and the mud system below the water is going to be exposed to the air. The mud will then acidify, releasing sulfuric acid and a whole range of heavy metals. After this occurs, those lower lake systems will essentially become a toxic swamp which will never be able to be recovered. The Australian government's only options to prevent this are to allow salt water in, creating a dead sea, or to pray for rain.
The link
provides information on the following locations
The United States California Texas Augusta Region (Georgia, South Carolina, North Carolina) Florida
South America Argentina Brazil Paraguay Uruguay Bolivia Chile
Africa faces food shortages and famine. Kenya Tanzania Burundi Uganda South Africa
Middle East and Central Asia Iraq Syria Afghanistan Jordan
Google Image Result for http://www.greatdreams.com/climate/Countries_by_agricultural_drought.png
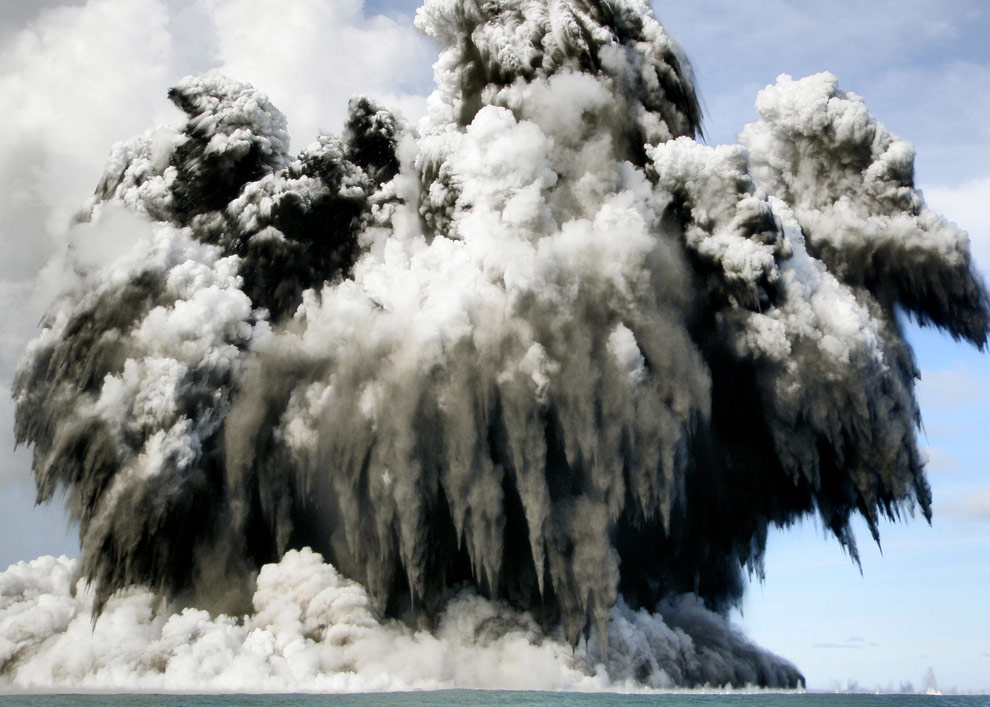
Where Do the Nastiest Hurricanes Emerge?
University of California at Berkeley physics grad student Robert Rohde used all available data from government sources to map 150 years’ worth of hurricane tracks through September 2005.

Map: Where Do the Nastiest Hurricanes Emerge? | Natural Disasters | DISCOVER Magazine
Wednesday, 18 March 2009
TerraPass | Balance your carbon emissions and fight climate change

Chocolate bars. They're supposed to taste good, but can they also be good? We think so!
Our Climate Change Chocolate bar is meant to educate while tasting great. It comes in a wrapper with 15 tips for lightening your environmental impact. These helpful hints teach you how to save energy by making small changes to your daily habits
TerraPass | Balance your carbon emissions and fight climate change

Munich Re Group - Geo Risks
Losses from geo risks are increasing dramatically worldwide. Munich Re has been researching geoscientific phenomena, their risks and their loss potentials, since 1974.

Tuesday, 17 March 2009
water scarcity
What is water scarcity? Imbalances between availability and demand, the degradation of groundwater and surface water quality, intersectoral competition, interregional and international conflicts, all contributes to water scarcity.
Scarcity often has its roots in water shortage, and it is in the arid and semiarid regions affected by droughts and wide climate variability, combined with population growth and economic development, that the problems of water scarcity are most acute

Water stress in Europe - Maps and Graphics at UNEP/GRID-Arendal
10 figures for the report "Water stress in Europe, can the challenge be met?" published in 1997. Water resources, pesticides pollution, life expectancy...
Water stress in Europe - Maps and Graphics at UNEP/GRID-Arendal

EarthTrends | Environmental Information

EarthTrends is a comprehensive online database, maintained by the World Resources Institute, that focuses on the environmental, social, and economic trends that shape our world.

10 ideas changing the world right now

The global economy is being remade before our eyes. Here's a guide to the future of the economy, the environment, medicine and more
News articles and special reports of current events - TIME.com
Sunday, 15 March 2009

National Accounts of Well-being
What are National Accounts of Well-being and why do we need them?
nef has set out a radical proposal to guide the direction of modern societies and the lives of people who live in them. In contrast to the conventional narrow focus on economic indicators, it calls for governments to directly and regularly measure people’s subjective well-being: their experiences, feelings and perceptions of how their lives are going, as a new way of assessing societal progress.
LONDON Tube map
The movie above is a draft look at our 3D London Tube Map with the lines laid out according to their geographic location.
London Tube Map Geography:Visualisation Draft from digitalurban on Vimeo.

JPL Climate Time Machine
INTERACTIVE maps of case studies that show changes in sea level, ice melt, temperature changes, average global temperatures
Thursday, 12 March 2009
Amazon could shrink by 85% due to climate change
Scientists say 4C rise would kill 85% of the Amazon rainforest
Even modest temperature rise would see 20-40% loss within 100 years

Amazon could shrink by 85% due to climate change, scientists say | Environment | guardian.co.uk
Monday, 9 March 2009


Wired world - the global growth of mobile phone use | Business | guardian.co.uk
6 in 10 people now subscribe to a mobile phone
Wired world - the global growth of mobile phone use | Business | guardian.co.uk
China plans 59 reservoirs to collect meltwater
China is planning to build 59 reservoirs to collect water from its shrinking glaciers as the cost of climate change hits home in the world's most populous country.
The far western province of Xinjiang, home to many of the planet's highest peaks and widest ice fields, will carry out the 10-year engineering project, which aims to catch and store glacier run-off that might otherwise trickle away into the desert.
Behind the measure is a desire to adjust seasonal water levels and address longer-term concerns that downstream city residents will run out of drinking supplies once the glaciers in the Tian, Kunlun and Altai mountains disappear.
Anxiety has risen along with temperatures that are rapidly diminishing the ice fields. The 3,800-metre Urumqi No1 glacier, the first to be measured in China, has lost more than 20% of its volume since 1962, according to the Cold and Arid Regions Environmental and Engineering Research Institute (Careeri) in Lanzhou.
About 80% of the glaciers in the Tian (Heaven) range have declined, though increased precipitation has also led a small number to expand.
To deal with the consequences, Xinjiang will set aside 200m yuan (£20m) for each of the next three years. In the first phase, 29 reservoirs will be built with a combined capacity of 21.8 billion cubic metres of water, according to the Xinhua news agency.
Wang Shijiang, director of Xinjiang Water Resource Department, told the agency that the mountain reservoir system was designed to "intercept" meltwater so that it could be used more efficiently for irrigation and to adjust for seasonal variations in rainfall.
Xinjiang is particularly dependent on a steady supply of meltwater from glaciers, which act as solid reservoirs that store precipitation in the winter and release it in the summer.
Few city residents understand the problem because in recent years water supplies have surged thanks to the extra meltwater and increased rainfall. The excess supply has been used to water golf courses and make artificial snow for a ski slope in semi-desert Urumqi. But scientists say the glut is unsustainable because it comes from the release of water that has built up over thousands of years.
"At the moment there is plenty of water in the big cities. But it is hard to say how long it will last," said He Yuanqing, a glaciologist at Careeri. "On one hand, global warming is accelerating the melt. But on the other, it is increasing rainfall, so we need a way to store the extra water."
Estimates of how long it will take Urumqi's glacial water supplies to start to decline range from 40 to 100 years.
It is unclear, however, how long the water can be stored without replenishment. Experts have previously called for the reservoirs to be built underground so that the water does not evaporate in the summer, when Xinjiang has the highest average temperatures in China.
Over-exploitation of river systems and oases has exacerbated the problem. The volume of water in the once vast Aibi lake in Xinjiang has decreased by two-thirds over the past 50 years, the Beijing News reported today.
In terms of glacier melt, the worst affected area in China is the Tibetan plateau, often described as "the roof of the world". Last month, Chinese scientists warned that glaciers on the plateau had lost 989 million cubic metres over the past 40 years and were continuing to melt at a "worrying speed". They added that ice fields had shrunk by 196 sq kilometres, equivalent to a quarter of New York city.
plans 59 reservoirs to collect meltwater from its shrinking glaciers | Environment | The Guardian
Worldometers - real time world statistics
Statistics on Population ,Economy, Society and Media, Environment, Food, Water, Energy, Health,
Ageing UK

- Every hour life expectancy in Britain rises by another 16 minutes.
- A man of 60 can expect to live for another 20.5 years and a woman of teh same age for 23.6 years.
- The percentage of the population aged under 16 bhas been declining since 1995 and for the first time ever, has dropped below the percentage of the population of state pensionable age.
- There were more then 11 million people over state pension age in 2005.
- The fastest growing group are those aged 80 years and over and constitute 4.5 % of the total population. This age group increased by over 1.1 million between 1981 and 2007.
- The mortality rate for the population aged over 75 has fallen from 137 deaths per thousand in 1911 - 1915, to 83 deaths per thousand in 2006 - 2007.
- There are around 9,000 centenarians in the UK, a 90 fold increase since 1911.
- At the currrent rate of expansion teh UK's centenarian population could reach over 40,000 by 2031.
- The annual number of deaths fell to 571,000 in 2007 from 599,000 in 2001.
- In 2007 the UK,s total fertility rate was 1.9 children per woman below the replacement rate of 2.10.
Sunday, 8 March 2009
Coastal processes
Erosion
The sea changes and shapes the coastal landscape. Erosion is the wearing away and breaking up of rock and beach material found along the coast. Destructive waves will erode the coastline in the following four ways.
- The constant force of waves crashing on the shore damages it. This is called hydraulic action.
- Waves bring with them bits of rock and sand. These help to grind down cliffs. This is called abrasion.
- Waves cause rocks and pebbles on the shore to smash into each other and break down. This is called attrition.
- Acids contained in sea water will slowly dissolve certain types of rock. This is called corrosion or solution.

Saturday, 7 March 2009

CO2 emissions, birth & death rates by country, simulated real-time
The Breathing Earth simulation
Welcome to Breathing Earth. This real-time simulation displays the CO2 emissions of every country in the world, as well as their birth and death rates.
Please remember that this real time simulation is just that: a simulation. Although the co2 emission, birth rate and death rate data used in Breathing Earth comes from reputable sources, data that measures things on such a massive scale can never be 100% accurate. Please note however that the co2 emission levels shown here are much more likely to be too low than they are to be too high.
CO2 emissions, birth & death rates by country, simulated real-time
Thursday, 5 March 2009
Online Interactive ELearning Teaching Resource Library

Great ANIMATIONS
Cliffs and Wave cut platforms; Depressions; Long shore drift; Earthquake Hurricane Tornado; Tsunami; Volcano; Rainfall; Waterfalls
Online Interactive ELearning Teaching Resource Library. List of Teaching Resources.
Wednesday, 4 March 2009
Oxfam's Cool Tsunami in Asia - Index page
Tsunami in Asia brings together educational materials from Cool Planet, and information from the main Oxfam website and external sites, to enable teaching around the ongoing humanitarian crisis in Asia
Oxfam's Cool Planet for teachers - Tsunami in Asia - Index page
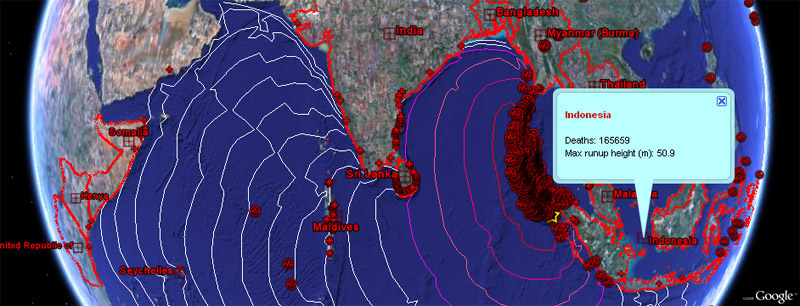
Interactive. Indian Ocean tsunami

Interactive map and access to Guardian special report
30.12.04 Interactive. Indian Ocean tsunami - how it happened | guardian.co.uk | guardian.co.uk
Tuesday, 3 March 2009
FEMA: Are You Ready?
You may need to survive on your own after a disaster. This means having your own food, water, and other supplies in sufficient quantity to last for at least three days. Local officials and relief workers will be on the scene after a disaster, but they cannot reach everyone immediately. You could get help in hours, or it might take days.
Basic services such as electricity, gas, water, sewage treatment, and telephones may be cut off for days, or even a week or longer. Or, you may have to evacuate at a moment’s notice and take essentials with you. You probably will not have the opportunity to shop or search for the supplies you need.
A disaster supplies kit is a collection of basic items that members of a household may need in the event of a disaster
FEMA: Are You Ready?
Asian Tsunami
An earthquake on Boxing day, December 26, sent huge waves crashing into 11 Asian countries, wiping out entire communities. It's estimated that 5 million people have been made homeless by the disaster. British people have so far donated £76m to the fund to help the survivors. Students learn how the tsunami started, how people have been affected and what they can do to help.

CBBC Newsround | Teachers | Citizenship 11 14 | Subject areas | Globalisation Environmental | Asian Tsunami
Tsunami links
BBC “Asia quake disaster – in depth” http://news.bbc.co.uk/1/hi/in_depth/world/2004/asia_quake_disaster/default.stm
Home page for BBC News reports on the 26/12/04 earthquake and subsequent Tsunami damage. BBC Asia Earthquake Disaster
http://news.bbc.co.uk/cbbcnews/hi/specials/2004/asia_earthquake_disaster/default.stm
BBC home page for reports aimed more at children.
BBC “Tsunami among world's worst disasters”
http://news.bbc.co.uk/1/hi/world/asia-pacific/4128509.stm
Article with brief descriptions comparing effects of various natural disasters since 1500s.
CNN “Waves of Destruction”
http://edition.cnn.com/SPECIALS/2004/tsunami.disaster/
Home page for CNN reports.
ABC News Tsunami page
http://abcnews.go.com/Technology/Tsunami/
Home page for ABC News reports.
Guardian Unlimited – Special Report
http://www.guardian.co.uk/tsunami/0,15671,1380306,00.html
Links to features and resources. Animations very useful. (May be slow to load.)
Earth Observatory – Natural Hazards
http://earthobservatory.nasa.gov/NaturalHazards/natural_hazards_v2.php3?img_id=12640
Map of epicentre, immediate plate boundaries and aftershocks.
BBC animated guide
http://news.bbc.co.uk/1/hi/world/asia-pacific/4136289.stm
Slides with (limited) animation showing affected area, formation of tsunami and results.
BBC “How the quake unfolded”
http://news.bbc.co.uk/1/shared/spl/hi/pop_ups/04/asia_pac_asia_earthquake_explained/html/1.stm
Illustrated description of the event. (7 “slides”)
National Oceanic and Atmospheric Administration animation
http://www.noaanews.noaa.gov/video/tsunami-indonesia2004.mov
5.8Mb QuickTime animation showing shockwaves spreading across complete Indian Ocean area.
AIST animation
http://staff.aist.go.jp/kenji.satake/animation.gif
1.1Mb animated GIF. (Plays in browser but can also be downloaded for more “controlled” viewing in a graphics package that supports this type of file.) Shows time after initial quake.
Discovery Channel animation of Indonesian tsunami
http://media.dsc.discovery.com/news/media/tsunami_wmp.html
PBS “Savage Earth – waves of destruction”
http://www.thirteen.org/savageearth/animations/tsunami/index.html
3 Flash slides with description.
US Geological Survey http://walrus.wr.usgs.gov/tsunami/stoch_low.html
2.2Mb QuickTime movie of theoretical tsunami off US Pacific coast.
Federal Emergency Management Agency tsunami “Fact Sheet”
http://www.fema.gov/hazards/tsunamis/tsunamif.shtm
A variety of useful resources including information on past tsunamis, FAQs and “Great Waves” brochure.
ITIC “Great Waves” brochure
http://www.prh.noaa.gov/pr/itic/library/pubs/great_waves/tsunami_great_waves.html
Excellent resource for download (large Acrobat file – 9.8Mb) or online viewing. Photos and diagrams useful for all ages.
Federal Emergency Management Agency “Tsunami for Kids”
http://www.fema.gov/kids/tsunami.htm
Limited information but interesting “Tsunami Warning” storybook. (See link on left of page.)
The tsunami in the Indian Ocean
The tsunami in the Indian Ocean has touched the lives of many people around the world. The GA offers its condolences to all those who have been affected by the tragedy. We also recognise that in events like this, it is the role of geography to help young people understand and make sense of what has happened.

Geographical Association - Past Themes - The tsunami in the Indian Ocean
Sunday, 1 March 2009


Defence Dynamics Teachers Resources
![]()
Earthquakes View material
Ecosystems, farming & migration View material
Energy and resources View material
Flooding View material
Managing ecosystems View material
Migration View material
National Parks View material
Sustainable Development View material
Tropical Storms View material
Tsunami View material
Volcanoes
Defence Dynamics
Local Futures Website - LFN Update: Barometer November 2008
The Local Futures Group is a research and strategy consultancy that provides a geographical perspective on social and environmental change, set within a 21st century knowledge economy. We introduce this perspective into public policy and corporate strategies, both in the UK and internationally.
SROLL DOWN to Local Futures Barometer Archive
PDF Reports on Well Being; transport; Local Amenities; Labour Market; Education; Employment growth; Demography; Business and Enterprise; Housing Affordability; Health Barometer; Deprivation Barometer; Crime Barometer; Inequality in knowledge economy; First time buyers affordability; Local carbon footprint; Migrant Labour; Local deprivation; Skills; Life expectancy;Access to services and amenities; Geography of crime; Geography of Carbon Footprint;
Local Futures Website - LFN Update: Barometer November 2008
Subscribe to:
Posts (Atom)